Key information
Publication type: General
Publication date:
Contents
Introduction
This data analysis, produced by the London Assembly Research Unit, provides an overview of Londoners’ homes, including their number, size, condition, cost, age and ownership. The report is intended to provide a snapshot, to give as accurate a picture as possible of what the capital’s housing stock looks like today.
The information presented in the report is based on published data from a range of sources, including the Census, English Housing Survey, and other outputs from the Ministry of Housing, Communities and Local Government (MHCLG), Office for National Statistics, Ofcom, the Valuation Office Agency and Greater London Authority.
The analysis was originally undertaken at the request of the Assembly’s Planning & Regeneration Committee, to inform the Committee’s future investigations. It also covers topics relating to the remits of the Assembly’s Housing, Environment, Fire, Budget & Performance, Transport and Economy, Culture & Skills Committees.
This webpage displays highlights of the paper. Please download the full paper for a range of other data visualisations and source information.
Number and density of homes
This section presents data on the overall number of homes in London, broken down by tenure. It also discusses the rise in the number of homes in the past 20 years. Finally, this section presents data on housing density, which is much higher in London than elsewhere in the country.

Type and size of homes
This section considers how many homes of different types London has, and what size they are. It presents data on how many households live in different types of home, the number of bedrooms they have, and households in houses of multiple occupation. The section includes a focus on tall buildings, which have grown significantly as a proportion of London’s housing stock in the past 20 years.


Tenure and ownership
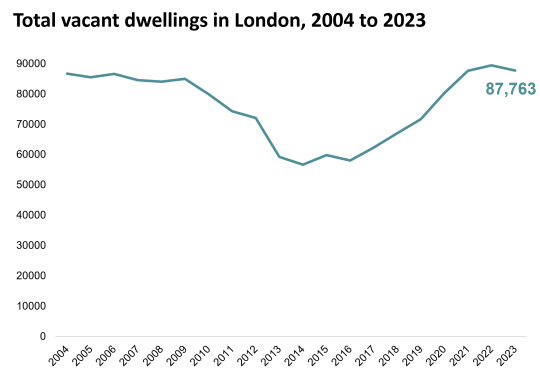
This section presents data on the ownership and costs of London homes. It includes data on how many homes are owner-occupied, in shared ownership, rented privately, or social housing. The section also presents data on how many homes are leasehold properties, which is more common in London than elsewhere in the country. Finally, this section provides information on the number of vacant homes in London.

Quality, safety and efficiency
This section present a range of data relating to the condition of London’s homes. This includes information on how many homes meet quality standards, defined by the presence of hazards such as damp and mould, and other safety hazards. The section presents data on key fire safety issues for London’s tall buildings, including how many have had dangerous cladding removed. Finally, the section includes information on the energy efficiency of London’s homes, presenting overall efficiency ratings and the prevalence of specific features designed to improve energy efficiency.

Amenities
This section presents data on the prevalence of several key amenities in London’s homes. These are the provision of parking for cars, electric vehicle charge points, gardens, and high-speed broadband.

Related documents
London's housing stock