Key information
Publication type: General
Publication date:
Contents
Executive Summary
As an equal, diverse and inclusive organisation, we, the Greater London Authority (GLA), are committed to tackling any form of structural and persistent inequality. This pay gap report and supporting action plan have been specifically developed to deliver this ambition.
This is the first year we have produced a combined pay gap report which provides the following analysis:
- ethnicity pay gap
- disability pay gap
- gender pay gap
This report is consistent with our overarching objective and commitment to lead on tackling inequalities and to develop a workforce reflective of London. Salaries at the GLA are determined through a job evaluation scheme, so that the Authority pays the same salary to roles of equal weight. Job evaluation evaluates the job and not the post holder. It makes no reference to any personal characteristics of existing or potential job holders.
The median pay gap is the difference between the midpoints in the ranges of hourly earnings of the two staff groups of interest. It takes all salaries in the sample, lines them up in order from lowest to highest, and picks the middle salary.
The mean pay gap is the difference between the average hourly earnings of the two staff groups of interest.
Table 1 below shows both the pay gap analysis and comparative data. It highlights changes in the last year regarding the three protected characteristics as follows:
Ethnicity
- The ethnicity pay gap analysis is based on a declaration rate of 95%. While this is relatively high, it means than 1 in 20 staff are not included. The key findings are as follows:
- As at 31 March 2021, we had an overall median ethnicity pay gap of 11.10% and a mean ethnicity pay gap of 13.71%. The mean pay gap has fallen since 2020, but the median pay gap has hardly changed.
- The mean pay gap has shifted due to BAME staff turnover at lower grades and the recruitment of BAME staff at higher grades. However, the median pay gap has not changed much as there has been little change in the composition of the workforce.
- The median ethnicity pay gap for part time workers is higher than for full time workers. However, the mean ethnicity pay gap for part time workers is lower than for full time workers.
- An ethnicity pay gap exists for all earnings quartiles (for both mean and median pay), except for the upper middle quartileReference:1. In the last year, the median pay gap for all quartiles has increased, apart from the upper quartile, which has come down.
- For staff on spot salaries, the median ethnicity pay gap and mean ethnicity pay gap are negative. This indicates that BAME staff in this salary group are paid more than White staff.Reference:2 However, this group had an above average non-disclosure rate of ethnicity, as well as few staff overall. This impacts the completeness of the analysis, so these findings could change if disclosure rates were higher.
- There is no median bonus pay gap (0%) and a mean bonus pay gap of 11.89%. This means BAME staff received a smaller mean annual payment than White staff.
- A similar proportion of White staff received a bonus payment in 2021 (14.4%) compared to BAME staff (13.5%).
- After conducting intersectional analysis, it’s clear that our BAME male employees have much larger mean and median pay gaps than overall.
Disability
This is the first year we have analysed our disability pay gap and is based on a declaration rate of 91%. Again, whilst the declaration rate is relatively high, approximately 1 in 10 staff were not included. The key findings are as follows:
- As at 31 March 2021, we had a median disability pay gap of 8.59% and a mean disability pay gap of 8.34%.
- The disability pay gap indicates that disabled staff are less likely to be employed at higher grades compared with other staff.
- The disability pay gap only affects full time staff and not part time staff.
- A median disability pay gap exists for all earnings quartiles, except the upper quartile, which is negative (-7.98%). There is a mean disability pay gap for all quartiles.
- There is no median bonus pay gap (0%), while a mean bonus pay gap exists of 4.84%. This shows that disabled staff received a smaller mean annual payment than non-disabled staff.
- However, a higher proportion of disabled staff received a bonus payment in 2021 (19.1%) compared to non-disabled staff (13.5%).
- After conducting intersectional analysis, it’s clear that disabled women and disabled BAME staff have much larger mean and median pay gaps overall.
Gender
The gender pay gap analysis is based on a declaration rate of nearly 100% and the key findings are as follows:
- As at 31 March 2021 the GLA had a median gender pay gap of 2.08% and a mean gender pay gap of 4.93%; both have decreased since 2020.
- The mean and median gaps have decreased in the last year due to the fact that there has been a narrowing in the proportion of men and women working at higher grades in the GLA (though men are still more likely to).
- The mean and median pay gaps for part time workers are higher than for full time workers; the mean and median pay gaps for full time staff have decreased since 2020. For part time staff, the mean pay gap has decreased in the last year while the median pay gap has increased.
- The mean and median gender pay gaps exist only for staff in the upper quartile of earnings at the GLA.
- For staff on spot salaries, there is no median gender pay gap (0%) while there is a mean gender pay gap of 3.76%.
- There is no gender median bonus pay gap (0%), while a negative mean bonus pay gap exists of -5.02% i.e. women received a slightly larger mean annual payment than men.
- A similar proportion of women working at the GLA received a bonus payment in 2021 compared to men (both 13.6%).
Next steps
This report should be read alongside our published Pay Gap Action Plans for Ethnicity, Disability and Gender. These are live action plans which capture our progress against the initiatives set out in the plans . We will continue to monitor progress against the action plans and provide annual updates.
1. Introduction
1.1 Background
Developing a workforce which reflects the demography of the city it serves is a key priority for us, the Greater London Authority (GLA). We are determined to tackle inequality in any form and publishing the pay gaps supports this aim.
We published our ethnicity pay gap in March 2018, one of the first organisations to do so. Since then we have published annual ethnicity pay gap reports.
This year (2021) is the first time that we are publishing our disability pay gap, ahead of any statutory responsibility to do so.
We first published a gender pay gap report in 2016, ahead of any legislative requirement to do so. Since this initial report, the Equality Act 2010 (Gender Pay Gap Information) regulations came into force in 2017. This required public bodies with 250 or more employees to report on their gender pay gap. We have published annual gender pay gap reports since then, together with a programme of activity to help address this gap. Salaries at the GLA are determined through a job evaluation scheme, so that the Authority pays the same salary to roles of equal weight. Job evaluation evaluates the job and not the post holder. It makes no reference to any personal characteristics of existing or potential job holders.
1.2 Methodology
The median pay gap is the difference between the midpoints in the ranges of hourly earnings of the two staff groups of interest. It takes all salaries in the sample, lines them up in order from lowest to highest, and picks the middle salary.
The mean pay gap is the difference between the average hourly earnings of the two staff groups of interest.
The pay gap is calculated using the formula below, in accordance with government guidance:
A – B_
A X 100
1.3 Date of reporting
As a public sector body, the snapshot date for gender pay gap data collection is on 31 March each year. For consistency, the ethnicity and disability pay gap data will also use this date. This report is therefore based on our pay gaps as of 31 March 2021.
1.4 Disclosure rates
On 31 March 2021, we had 1,129 employees. The number of staff members included in the pay gap reporting exercise were as follows:
Ethnicity Pay Gap – 1,068 (disclosure rate – 94.6%)
Disability Pay Gap – 1,023 (disclosure rate – 90.6%)
Gender Pay Gap – 1,128 (disclosure rate – 99.9%)
We are a single status organisation and do not have different staff groups (as all staff are officers). This means that office-holders like Assembly Members and the Mayor are excluded from this pay gap analysis, alongside volunteers and agency staff.
1.5 Data collection
We collected data staff data on ethnicity, disability and gender via self-declaring on our internal HR system.
We use the term ‘BAME’ for reporting purposes only. Staff can select their ethnic group from a more detailed list. We recognise that Black, Asian and minority ethnic groups are all different. Each ethnicity has its own unique identity and they experience different barriers. Our BAME group includes all staff who have self-identified as Black, Asian, of mixed or multiple ethnicities, and of other ethnic groups.
As ‘disability status’ is simply self-declared, we do not ask for further details.
We collect data on our staff members’ sex and gender identity. The data used in previous gender pay gap reports have been for males and females (sex). Therefore, for consistency, this means that females are reported as women and males are reported as men. We appreciate that some colleagues may not see their sex and gender as the same nor identify within this gender binary. We welcome and value colleagues of all gender identities. We recognise non-binary identities by using gender-neutral language throughout our HR policies and communications and by working closely with the LGBTQ+ Staff Network group.
2. Ethnicity pay gap
2.1 Overall
In this report, we compare the overall ethnicity pay gap between BAME staff and White staff, taken as a whole. There is further analysis by separate groups (Asian or Asian British, Black or Black British, Mixed ethnicities and Other Ethnic Groups) where numbers allow. The White group includes White British, White Irish and White OtherReference:3.
On 31 March 2021, our overall median ethnicity pay gap was 11.10% and our mean ethnicity pay gap 13.71% (see Figures 2.1 and 2.2).
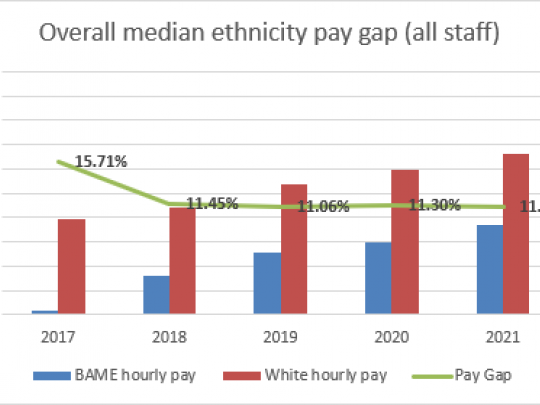
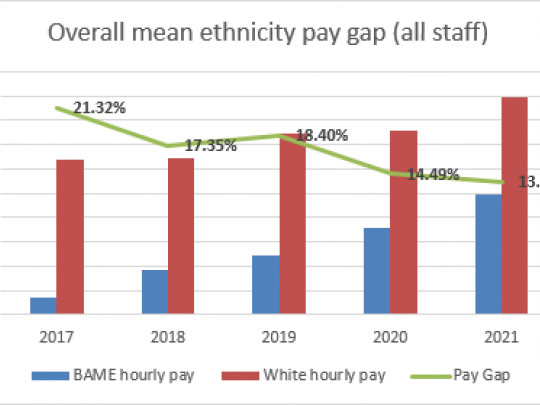
This indicates that the average hourly rate of pay for BAME staff remains less than the average hourly rate of pay for White staff. However, the gaps have shrunk since 2017, as well as in the last year (only the mean ethnicity pay gap has decreased; the median ethnicity pay gap is virtually unchanged from 2020).
Changes in the median are usually due to large changes in the structure of the workforce. However, the workforce composition in terms of BAME and White staff has changed little from 2020 to 2021 (net reduction of 17 staff overall)Reference:4. For ethnicity pay gap reporting there are 18 fewer BAME staff and two fewer White staff (three others did not declare their ethnicity). The mean ethnicity pay gap has fallen, as most BAME staff who left in this period were under Grade 9 (lower hourly pay rates). There has also been recruitment of BAME staff at Grades 9 and higher (on higher hourly rates of pay)Reference:5.
The overall national and London pay gaps usually come from the Annual Population Survey (APS). However, major disruption to how this survey is normally carried out, means it has been difficult to get robust estimates from it. An Office for National Statistics (ONS) article documents the challenges faced in running the survey reliably. Therefore, no figures for 2020 are shown in this report. We do however, direct readers to previous years’ data when data collection on the APS was carried out as normal.
In 2019, the final year of undisrupted survey fieldwork on the APS, the national (UK) median ethnicity pay gap for all workers was 1.6%. The median ethnicity pay gap for workers in London in 2019 was 28.2%. Mean ethnicity pay gaps are not presented as they are not robust enough. London’s ethnicity pay gap is far higher than nationally. This is at least partly because London has a much larger proportion of BAME employees among its workforce than the rest of the country. London wages also tend to be higher than elsewhere. Our median ethnicity pay gap is smaller than the average across London in 2019.
Figures 2.3 and 2.4 show the median and mean pay gaps respectively for the separate ethnic minority groups at the GLAReference:6.
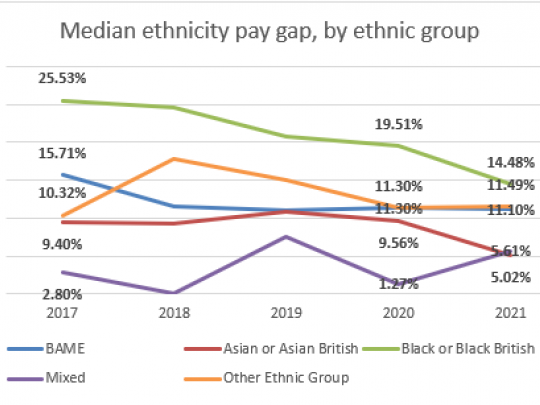
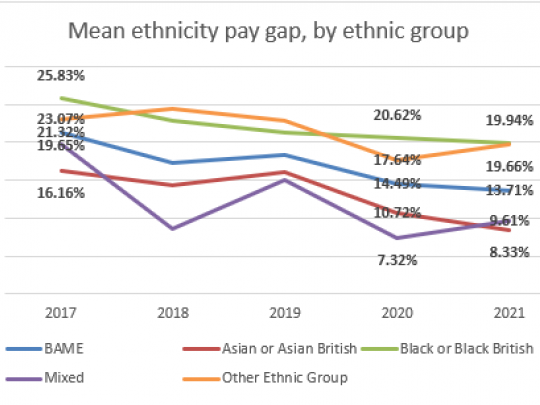
The highest ethnicity pay gap is among Black or Black British staff. This group has a median pay gap of 14.48% and a mean pay gap of 19.94%. The gap has fallen since 2017, as well as in the last year.
The smallest ethnicity pay gap is among Asian or Asian British staff. This group has a median pay gap of 5.02% and a mean pay gap of 8.33%. The gap has fallen since 2017, as well as in the last year.
All ethnic groups’ pay gaps have decreased since 2017, except for Mixed ethnicity staff. For this group, the median pay gap, particularly, has increased to 5.61% from 2.80%. However, the mean pay gap has decreased from 19.65% to 9.61%. These results should be treated with caution given how few staff have a Mixed ethnicity. This make comparisons less robust (in 2021, only 52 staff said they are from a mixed ethnic background).
2.2 Full time/part time status
For full time workers, the overall median ethnicity pay gap is 9.27% while the overall mean ethnicity pay gap is 14.77%. The median pay gap for part time workers is higher (11.49%) while the mean pay gap is lower at 5.62% (see Figure 2.5).
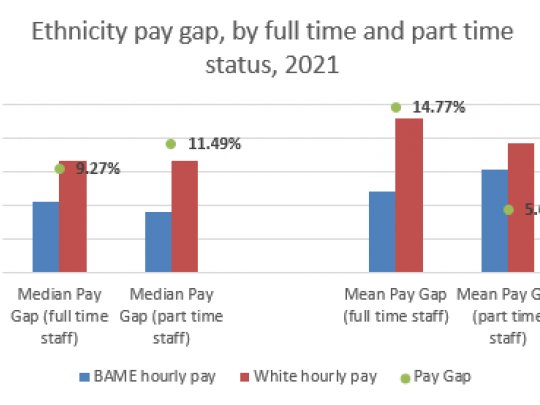
We did not feature this breakdown by full time and part time status in our previous GLA ethnicity pay gap reports. This means it is not possible to compare data from previous years.
2.3 Earnings quartile
Analysing by earnings quartile means dividing our workforce into four equal sized groups and separating them according to the hourly pay rate. This starts from the lowest paid to the highest paid. We can then analyse the pay gaps within these four groups.
There is an ethnicity pay gap for all quartiles, except for the upper middle quartile. Figures 2.6 and 2.7 show these.
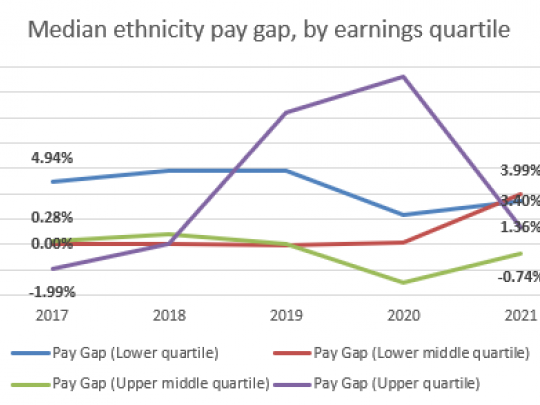
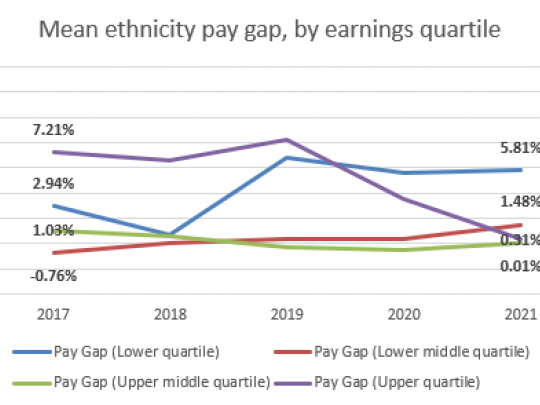
In the last year, the median pay gap for all quartiles has increased, apart from the upper quartile. The median pay gap for the upper quartile has come down from 13.18% in 2020 to 1.36% in 2021. The same is true of the mean pay gap, with the upper quartile’s mean pay gap falling from 3.49% to 0.31%.
2.4 Grade
In previous years, we have analysed ethnicity pay in relation to our grading structure. This provides a more in-depth look at the distribution of pay across the organisation. Our pay structure and policy on starting salaries and salary progression, means pay gaps within grades will always be bound by these pay rates. These are specified in the spinal column points. The exceptions are staff paid the London Living Wage and those on spot salaries (fixed rates not linked to defined spinal column points within our grading structure). Spot salaries are reserved for Executive Directors and Mayoral appointments.
For example, in April 2020, Grade 2 consisted of spinal column points 6 to 10 (see Table 2.1).
If all our Grade 2 staff had been in role for five years or more, they would be at the top of the spinal column. A new starter would almost always be paid at the bottom of the spinal column. This means that new starters bring down the mean hourly rate, but not necessarily the median hourly rate. The median hourly rate depends on the number of staff at a grade and staff changes.
Given the grading system, each grade has upper and lower bounds for what the pay gaps can never exceed (see Table 2.2):
For example, if a White staff member is at the highest Grade 2 spinal column point while a Black staff member is at the lowest, the gap is:
A – B_
A X 100
28,388 – 25,720_
28,388 X 100
2,668
28,388 X 100
9.4%
Conversely, if a White staff member is at the lowest spinal Grade 2 column point, while a Black staff member is at the highest, the gap is:
A – B_
A X 100
25,720 – 28,388_
25,720 X 100
-2,668
25,720 X 100
-10.4%
Yearly changes are a result of staff changes year-to-year (the proportion of newer staff and longer serving staff). The ethnicity pay gaps by grade are not reported in this report but are available in the accompanying data tables.
The one salary group we will examine in this report are spot salaries. These are fixed rates determined at when a staff member starts, and which are not constrained to the same extent that graded salaries are. Nineteen staff at the GLA are on spot salaries, which is less than 2% of all staff.
For staff on spot salaries, the median ethnicity pay gap and mean ethnicity pay gap are negative. This shows that the average hourly rate of pay for BAME staff in this salary group is higher than the average for White staff (see Figures 2.8 and 2.9).
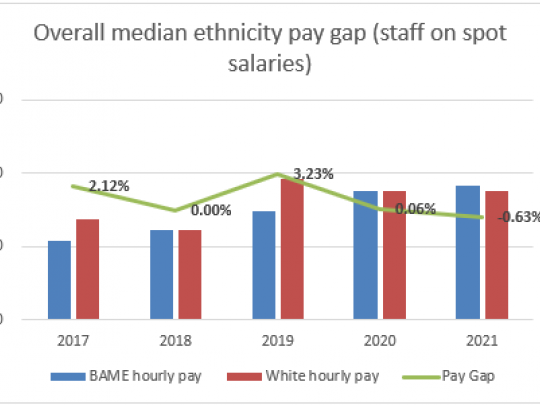
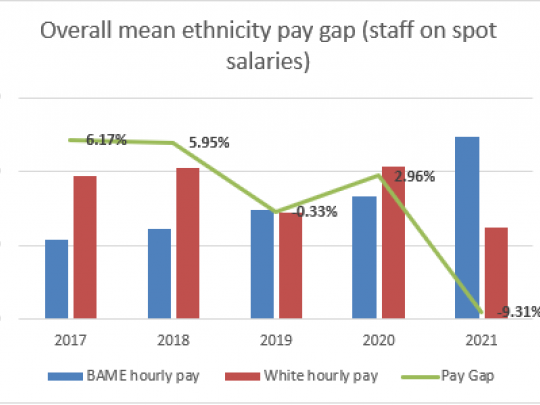
The overall ethnicity median pay gap for staff on spot salaries is -0.63%, while the mean pay gap is -9.31%. This has fallen since 2017 when the gaps were 2.12% and 6.17% respectively. The mean pay gap shifted considerably in the last year (12 percentage points).
The picture presented appears positive. However, there is a lower than average disclosure rate of ethnicity among this group (74%), as well as few staff overall within this group. This means the picture is incomplete and could change if disclosure rates were higher.
2.5 Bonus payments
Bonus pay is broadly defined as any remuneration in the form of money, vouchers, securities, securities options, or interests in securities. It relates to profit sharing, productivity, performance, incentive or commissionReference:7. We interpret recognition payments as an additional payment awarded for productivity/performance and therefore report it as a bonus payment.
Traditionally, we calculated recognition payments based on a formula using the hourly rate of pay and time taken to do the work. However, in January 2019 the Chief Officer rolled out a new methodology. This calculates a recognition payment with the nature of the work being recognised matched to specific criteria to determine the payment value .
In 2021, there is no median ethnicity bonus pay gap (0%), while there is a mean ethnicity bonus pay gap of 11.89%. This means that BAME staff received a smaller mean annual payment than White staff. The gaps in 2017 were between 13-17%, and were considerably higher in 2020. These have since fallen back to levels close to zero (see Figures 2.10 and 2.11).
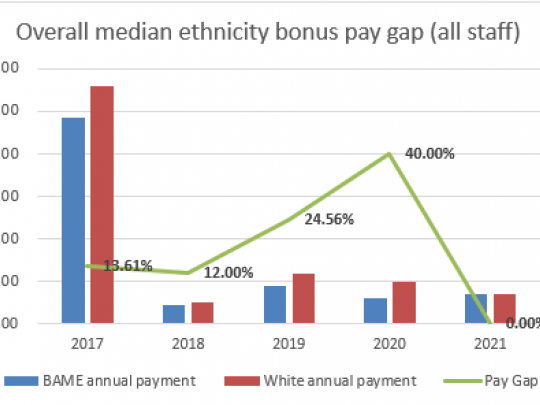
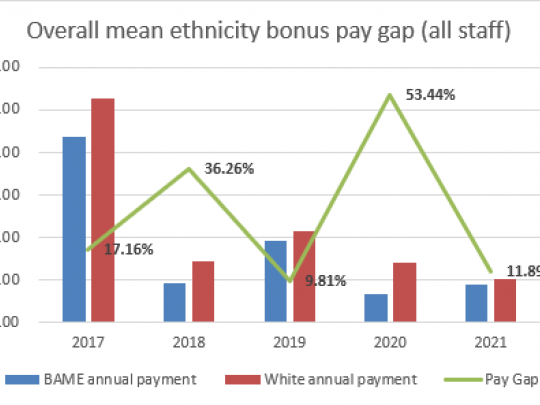
A similar proportion of White staff received a bonus payment in 2021 (14.4%) compared to BAME staff (13.5%).
2.6 Workforce composition
The proportion of BAME staff at the GLA has grown since 2017, though has not grown in the last year (see Table 2.3).
In 2021, we employed 326 BAME members of staff. There were 128 Asian or Asian British staff, 124 Black or Black British staff, 52 staff with a Mixed ethnicity and 22 with an Other Ethnic Group.
We produce detailed workforce reports every six months. However, for the purposes of ethnicity pay gap reporting, we examine two aspects of pay in particular:
- Distribution of salaries of BAME and White staff in £10k increments up to £100k, with those earning more than £100k in one group.
- Distribution of salaries of BAME and White staff in four equally sized salary groupings, not related to the GLA’s pay and grading structure.
Table 2.4 highlights clearly that our higher salary jobs are more likely to be held by White employees than BAME employees. Our workforce report covering 1 April 2020 to 31 March 2021 shows that 37% of London’s working-age population is BAME. As such, BAME staff are under-represented in all pay bands above £40,000.
Over half (52%) of our staff paid between £20,000 and £29,999 are BAME. In contrast, the proportion of staff paid over £100,000 who are BAME is 15%.
Table 2.5 shows the distribution of salaries of BAME and White staff in four equally sized salary groupings, not related to the GLA’s pay and grading structure. As a result, the salary groupings differ slightly each year.
Again, this show that BAME staff are less likely to be among our higher paid staff at the GLA. Group 4 shows that 33% of staff are BAME. However, this is an outlier due to the very low number of staff in this group overall (one staff change can cause a big percentage change).
3. Disability pay gap
3.1 Overall
As at 31 March 2021, we had a median disability pay gap of 8.59% and a mean disability pay gap of 8.34% (see Figure 3.1).
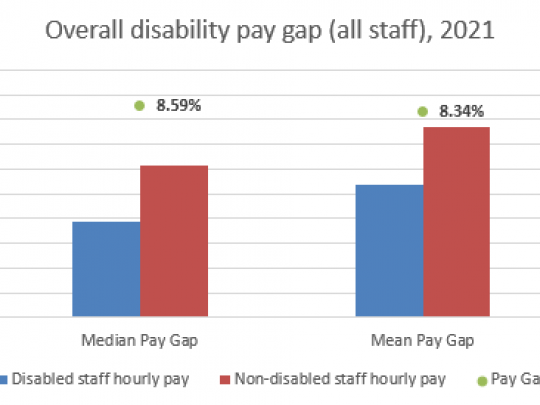
This indicates that our disabled staff receive an average hourly rate of pay lower than the average hourly rate of pay for non-disabled staff. The gaps are larger than the gender pay gaps, but not as large as the ethnicity pay gaps. Disabled staff are less likely to be employed at Grade 9 or above (47%) compared to non-disabled staff (54%).
As with ethnicity pay gap data, the overall national and London disability pay gaps usually come from the APS. The same issues apply here about the data for 2020 being less robust, as with the ethnicity pay gap data. This means that no figures for 2020 are shown in this report. However, we direct readers to previous years’ data when data collection on the APS was done as normal .
In 2019, the final year of undisrupted survey fieldwork on the APS, the national (UK) median disability pay gap for all workers was 14.8%. The median disability pay gap for workers in London in 2019 was 16.6%. Mean disability pay gaps are not presented as they are not robust enough. Our median disability pay gap is smaller than the London average in 2019.
3.2 Full time/part time status
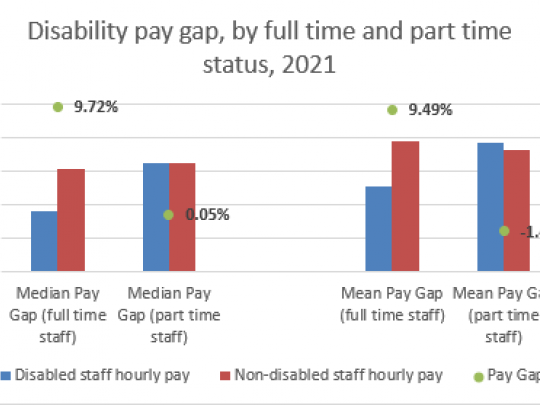
For full time workers, the median disability pay gap is 9.72% while the mean disability pay gap is 9.49%. There is no disability pay gap for part time workers: 0.05% is the median pay gap while the mean pay gap is -1.41% (see Figure 3.2).
The pay gap for part time workers (or lack of) can be explained by the fact that there are very few part-time disabled workers at the GLA, and the majority all work at Grades 7 or higher (6 out of 7). In contrast, the number of non-disabled part time workers is larger (125), with around one in five (22%) members of this group working below Grade 7.
The pay gap for part time workers (or lack of) can be explained by the fact that there are very few part-time disabled workers at the GLA, and the majority all work at Grades 7 or higher (6 out of 7). In contrast, the number of non-disabled part time workers is larger (125), with around one in five (22%) members of this group working below Grade 7.
3.3 Earnings quartile
A median disability pay gap exists for all earnings quartiles, except the upper quartile, which is negative (-7.98%). There is a mean disability pay gap for all earnings quartiles. Figures 3.3 and 3.4 illustrate these.
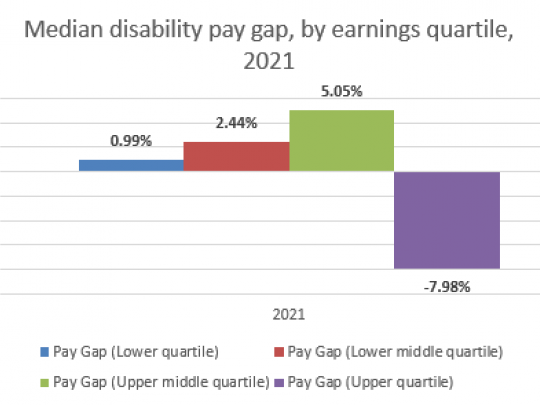
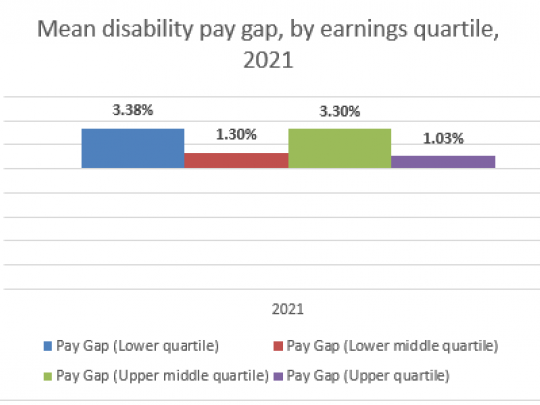
There is a disparity in the upper quartile of staff between the mean and median pay gaps. This is because disabled staff in this quartile are only employed between Grades 10 and 14. Other staff on this quartile are employed at a much wider range of grades, including those on spot salaries. Due to these extra non-disabled staff at Grade 15 and above (and no disabled staff), the average hourly rate is increased. This has an impact on the mean pay gap, skewing mean hourly rates for non-disabled staff higher. The median on the other hand is less affected. This is because it depends more on how staff are distributed on different pay grades in this quartile.
3.4 Grade
Earlier on in the report, we analysed the ethnicity pay gap in relation to staff on spot salaries. However, we cannot calculate the disability pay gap for this group. This is because there is no data regarding disabled staff for this salary group. It has the lowest disclosure rate for disability information of all GLA salary groups (63%). Those on spot salaries here are among the highest paid in the organisation. As data on disabled staff is incomplete for this salary group, this masks the true picture of pay gaps at this level.
The median and mean disability pay gaps by grade are found in the accompanying data tables.
3.5 Bonus payments
In 2021, there is no median disability bonus pay gap (0%), while a mean disability bonus pay gap exists of 4.84%. This means that in 2021, disabled staff received a smaller mean annual payment than non-disabled staff (see Figure 3.5).

However, a higher proportion of disabled staff received a bonus payment in 2021 (19.1%) compared to non-disabled staff (13.5%).
3.6 Workforce composition
Around one in 15 of our staff (6.6%) have shared that they are disabled (see Table 3.1).
For disability pay gap reporting purposes, we examine two aspects of pay in particular:
- Distribution of salaries of disabled and non-disabled staff in £10k increments up to £100k, with those earning more than £100k in one group.
- Distribution of salaries of disabled and non-disabled staff in four equally sized salary groupings, not related to our pay and grading structure.
Table 3.2 shows a pattern that our higher salary jobs are more likely to be staffed by non-disabled employees than disabled employees. Our workforce report covering 1 April 2020 to 31 March 2021 shows that 16% of London’s working-age population is disabled. Therefore, disabled staff are under-represented in most pay bands.
Ten per cent of our staff who are paid between £20,000 and £29,999 are disabled. In contrast, the proportion of our staff paid over £100,000 who are disabled is 0%. The £90,000 to £99,999 pay band shows that 24% of staff are disabled (above the 16% of working-age Londoners who are disabled). However, this is an outlier due to the very low number of staff in this pay band overall (one staff change can lead to a big percentage change).
Tabe 3.3 shows the salaries of disabled and non-disabled staff distributed in four equally sized salary groupings, unrelated to our pay and grading structure.
Again, what it illustrates is that disabled staff are currently less likely to be among our higher paid staff.
4. Gender pay gap
4.1 Overall
As of 31 March 2021, we had a median gender pay gap of 2.08% and a mean gender pay gap of 4.93% (see Figures 4.1 and 4.2).
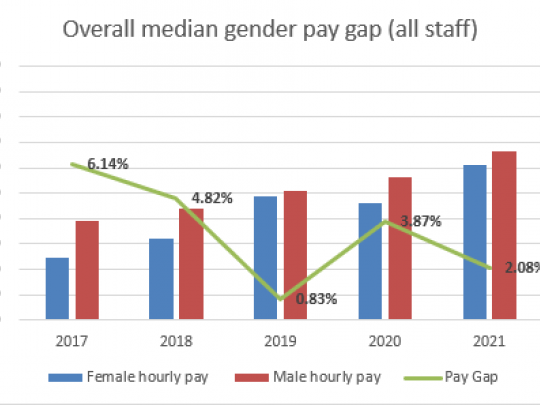
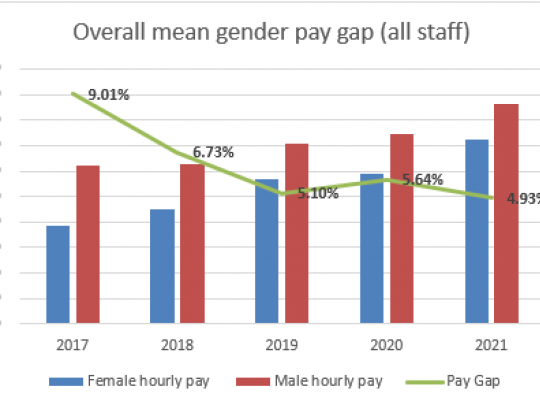
This shows that the average hourly rate of pay for women is still slightly less than the average hourly rate of pay for men. However, the gaps have shrunk since 2017, as well as in the last year.
The mean and median gaps have fallen in the last year. This is because there has been a shift in the proportion of men and women working at higher grades (9 or above). In 2020, 47% of women at the GLA worked at these higher grades, compared to 52% of men. This gap is why there is a pay gap. In 2021, as a result of staff turnover and recruitment, the mix of women and men at higher grades has changed. In 2021, some 53% of all women at the GLA worked at these higher grades, while 56% of all men did. Both have increased, but the gap between them has narrowed, which in turn influences the pay gaps.
Our pay gaps compare favourably to both the national (UK) and London pictureReference:8. The national median gender pay gap for all workers in 2021 was 15.4% and the mean gender pay gap was 14.9%Reference:9. The median gender pay gap for workers in London in 2021 was 16.2% and the mean gender pay gap was 21.1%.
4.2 Full time/part time status
For full time workers, the median pay gap is 3.87% while the mean pay gap is 4.10%. The pay gaps for part time workers is higher: 9.99% is the median pay gap while the mean pay gap is 14.94% (see Figure 4.3).
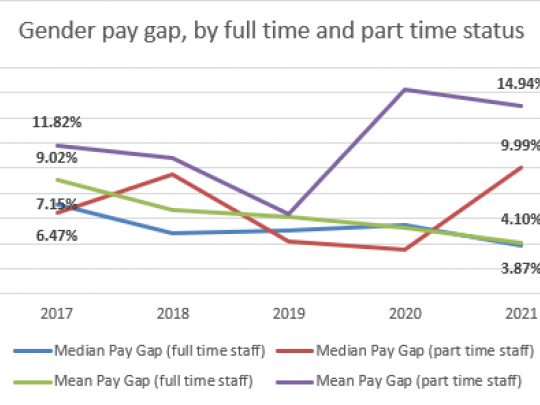
The pay gaps for full time staff have decreased since 2017. However, for part time staff, the gaps have increased.
4.3 Earnings quartile
A gender pay gap exists for the upper quartile (median pay gap of 1.96% and mean pay gap of 3.63%). There is a negative gender pay gap for the lower quartile (median pay gap of -2.50% and mean pay gap of -4.12%). Figures 4.4 and 4.5 show these.
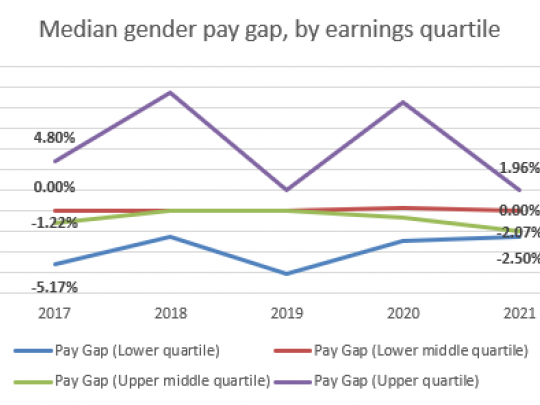
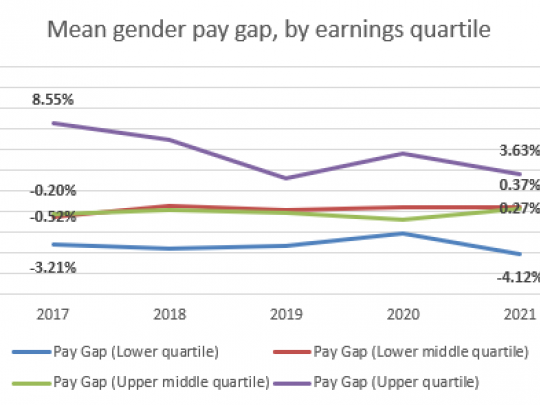
There is a near-zero pay gap for staff in the middle quartiles. However, a small negative median pay gap exists for staff in the upper middle quartile (-2.07%).
The gender pay gap for staff in the upper quartile has persisted since 2017. Although it has declined since then, as well as in the last year.
The negative pay gap for staff in the lower quartile has persisted since 2017. The median pay gap has declined since 2017, while the mean pay gap has increased slightly.
4.4 Grade
As described earlier, the one salary group we will examine in this report are spot salaries. These are fixed rates determined at the start of a staff member’s time at the GLA. As such, they are not constrained to the same extent that salaries within a grade are. The gender pay gaps by grade are available in the accompanying data tables.
For staff on spot salaries, there is no median gender pay gap (0%). There is a mean gender pay gap of 3.76% (see Figures 4.6 and 4.7 respectively).
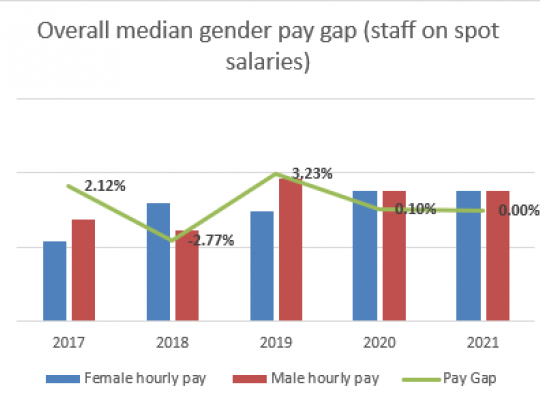
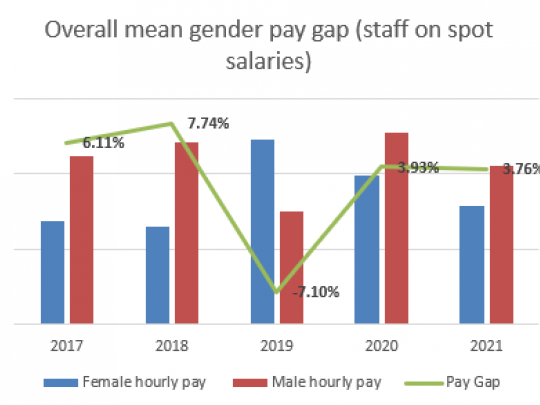
Both the median and mean pay gaps in this salary group have narrowed since 2017, as well as in the past year.
4.5 Bonus payments
In 2021, there is no median bonus pay gap (0%). The negative mean bonus pay gap of
-5.02% shows women received a slightly larger mean annual payment than men. There was only a small gap in 2017, but this rose dramatically in 2019. It has since fallen back to levels close to zero (see Figures 4.8 and 4.9).
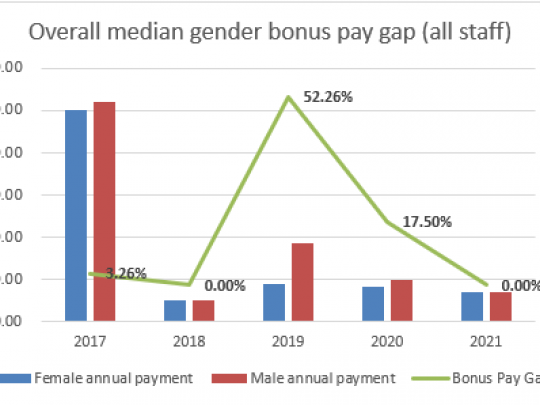
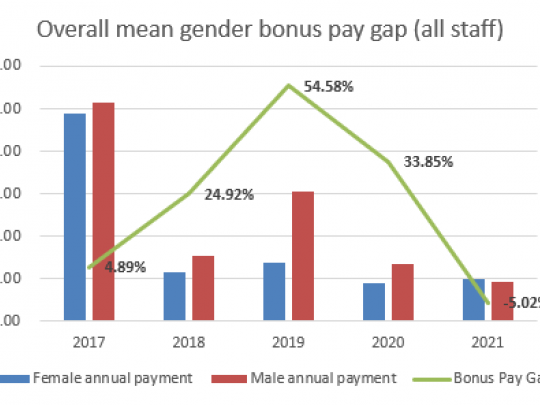
A similar proportion of women working at the GLA received a bonus payment in 2021 compared to men (both 13.6%).
4.6 Workforce composition
The proportion of female staff has grown every year since 2017 to 2020 with a levelling off to 2021 (see Table 4.1).
For the purposes of gender pay gap reporting, we examine two aspects of pay in particular:
- Distribution of salaries of female and male staff in £10k increments up to £100k. Those earning more than £100k are in one group.
- Distribution of salaries of female and male staff in four equally sized salary groupings. This is unrelated to our pay and grading structure.
Table 4.2 shows a clear pattern that our higher salary jobs are more likely to be staffed by men than women. Our workforce report covering 1 April 2020 to 31 March 2021 shows that 50% of London’s working-age population is female.
Fifty-nine per cent of staff who are paid between £20,000 and £29,999 are female. In contrast, the proportion of staff paid over £90,000 who are female is 47%.
Table 4.3 shows the distribution of salaries of female and male staff in four equally sized salary groupings. These are unrelated to our pay and grading structure. As a result, the salary groupings differ slightly each year.
The table shows that female staff are less likely to be among the very highest paid staff at the GLA. However, the median salary at the GLA is £50,396 and female staff make up a greater proportion of above-median salaries at the GLA (57%) compared with male staff (43%).
5. Intersectional Analysis
5.1 Gender and ethnicity
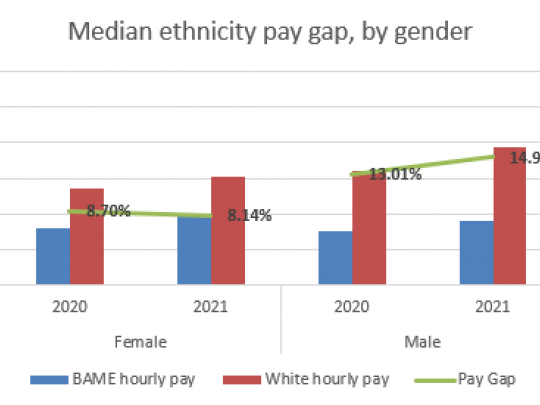
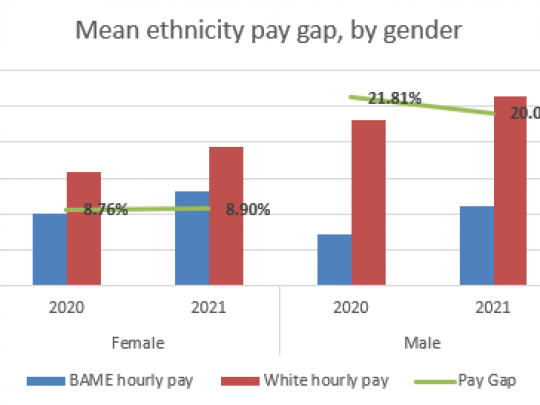
On 31 March 2021, overall, the median ethnicity pay gap for women was 8.14%, while the mean ethnicity gap for women was 8.90%. Overall, the median ethnicity pay gap for men was 14.92%, while the mean ethnicity pay gap for men was 20% (see Figures 5.1 and 5.2 respectively).
It was reported earlier that the overall median ethnicity pay gap is 11.10% and the mean ethnicity pay gap is 13.71%. This breakdown by gender, therefore, indicates that BAME men experience a larger effect than BAME women.
Figures 5.3 and 5.4 show the median and mean ethnicity pay gaps respectively for women in each separate ethnic minority group. Due to the low numbers of staff with some of these intersecting characteristics, these results should be viewed with caution.
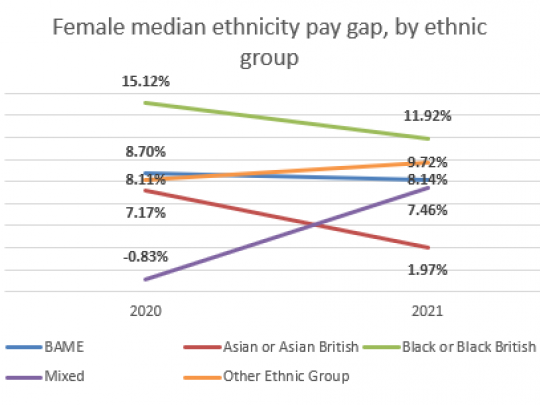
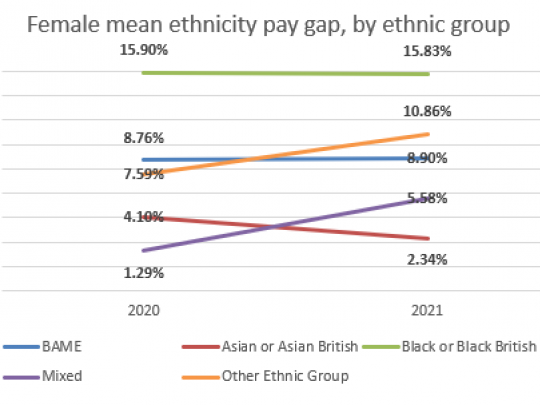
The largest pay gaps are among Black or Black British women (11.92% median; 15.83% mean) and women in the Other Ethnic Group (9.72% median, 10.86% mean). The smallest pay gap is for Asian or Asian British women (1.97% median; 2.34% mean). This shows Black or Black British women experience a double disadvantage, while Asian or Asian British women do not (though a pay gap exists).
The pay gaps for Black or Black British women and Asian or Asian British women have both fallen in the last year. However, the pay gap among Mixed ethnicity women has increased since 2020. The median pay gap has gone up by eight percentage points, while the mean pay gap has gone up by four points.
Figures 5.5 and 5.6 show the median and mean ethnicity pay gaps respectively for men in each separate ethnic minority group. Again, the low numbers of staff with some of these intersecting characteristics means that these results should be viewed with caution.
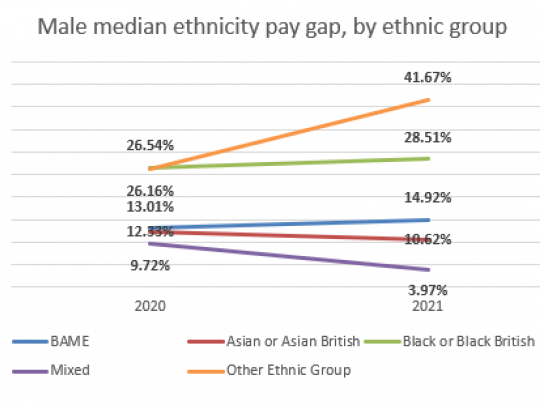
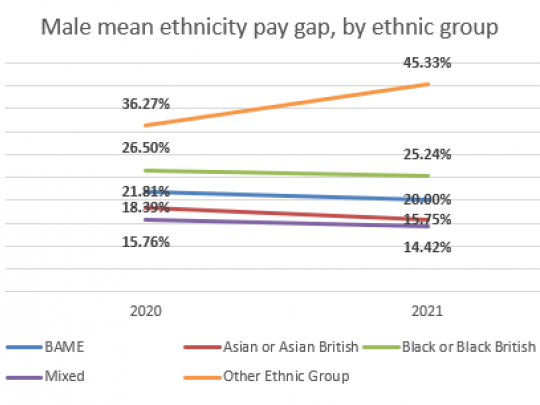
The largest pay gaps are among Black or Black British men (28.51% median; 25.24% mean) and men in the Other Ethnic Group (41.67% median, 45.33% mean). The smallest pay gap is for Mixed ethnicity men (3.97% median; 14.42% mean). This indicates that Black or Black British men and men in the Other Ethnic Group experience a double impact.
The median pay gaps for Black or Black British men and men in the Other Ethnic Group have both increased in the last year. However, the median pay gaps among Asian or Asian British men and Mixed ethnicity men have decreased.
The mean pay gaps follow the same pattern, except for Black or Black British men, where the pay gap has decreased slightly.
5.2 Ethnicity and disability
On 31 March 2021, the median disability pay gap for BAME staff was 23.87%, and the mean disability pay gap for BAME staff was 18.46%. For White staff, the median disability pay gap was 0.78%, while the mean disability pay gap was 4.28% (see Figure 5.7).
It was reported earlier that the overall median disability pay gap is 8.59% and the overall mean disability pay gap is 8.34%. This breakdown by ethnicity, therefore, shows that disabled BAME staff are doubly impacted.
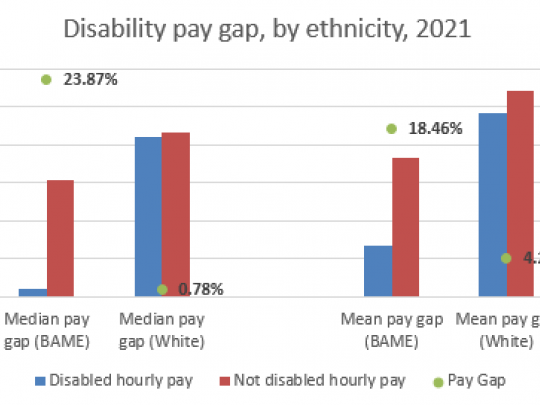
We have a low number of disabled staff. This means that looking at intersecting characteristics will be based on even lower numbers of disabled staff. As such, caution should be used when looking at these results.
5.3 Gender and disability
On 31 March 2021, the median disability pay gap for women was 7.91%, while the mean disability pay gap for women was 11.03%. For men, the median disability pay gap was 0%, while the mean disability pay gap was 3.30% (see Figure 5.8).
It was reported earlier that the overall median disability pay gap is 8.59% and the overall mean disability pay gap is 8.34%. When looking at the mean pay gap, this indicates that disabled women are doubly affected.
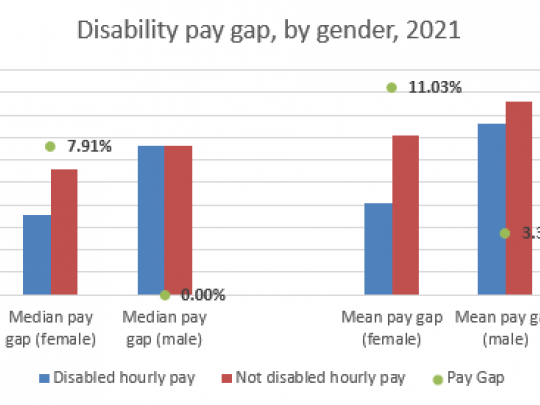
As mentioned earlier, these results should be viewed with caution due to the low number of disabled staff at the GLA.
6. Conclusion
Ethnicity
Our ethnicity pay gap remains the largest of all the pay gaps we examined. This indicates that the average hourly rate of pay for BAME staff is still less than that of White staff. However, the mean and median gaps have shrunk since 2017, and in the last year (though this decrease was very slight). The mean pay gap has shifted due to BAME staff turnover at lower grades and recruitment of BAME staff at higher grades. However, the median pay gap has changed little as there hasn’t been much change in the composition of the workforce.
The highest mean and median ethnicity pay gaps are among Black or Black British staff. As with all other ethnic groups these gaps have lessened since 2017. After conducting intersectional analysis, it is clear that BAME male staff have much larger mean and median pay gaps than overall.
Disability
This is the first year we have reported our disability pay gaps. As at 31 March 2021, we had a median disability pay gap of 8.59% and a mean disability pay gap of 8.34%. These gaps are larger than our gender pay gaps, but not as large as our ethnicity pay gaps. The disability pay gaps exist because disabled staff are far less likely to be employed at higher grades than non-disabled staff.
Some 91% of our staff shared disability information. This means around 1 in 10 of our staff were not included in the analysis. Therefore, the picture we present is not as complete as it could be. However, there are still some noticeable patterns. The mean and median disability pay gaps exist only among full time staff and not part time staff. Further intersectional analysis reveals that our disabled women and disabled BAME staff have far larger mean and median pay gaps overall.
Gender
We still have a small mean and median gender pay gap at the GLA. Women staff continue to receive a lower average hourly rate of pay compared to men. However, the gaps have shrunk since 2017, as well as in the last year. The mean and median gaps have decreased in this period because of a narrowing in the proportion of men and women at higher grades. Yet men are still more likely to be in these roles. However, the decrease has not occurred for all staff. In fact, for part time staff the mean and median gender pay gaps have increased. The mean and median gender pay gaps exist only for staff in the upper quartile of earnings at the GLA.
Next steps
This report should be read alongside our published Pay Gap Action Plans for Ethnicity, Disability and Gender . These are live action plans and we are making good progress against many of the initiatives set out within them. We will continue to monitor our progress against the action plans and provide annual updates accordingly.
We, along with other GLA Group organisations, have developed a framework to help the Mayor deliver his vision for a fair and equal city. This framework is known as the Diversity and Inclusion Action Standard. It focuses on what GLA organisations can do to achieve a diverse workforce reflective of London, and develop inclusive cultures where all groups can flourish . The Diversity and Inclusion Action Standard sets out the ambition to work towards eliminating pay gaps between different groups. Our pay gap report and related action plans support delivery against this commitment.
References
- Reference:1An earnings quartile is where our workforce has been divided into four equal sized groups, ordered by the hourly pay rate, starting from lowest paid to the highest paid.
- Reference:2Spot salaries are fixed rates not linked to defined spinal column points within our pay grading structure and reserved for Executive Directors and Mayoral appointments.
- Reference:3In some other ethnicity pay gap reports, employers have chosen the reference category to base pay gaps on to be ‘White British’. The GLA published its first ethnicity pay gap report with a reference category of a combined White group, so for consistency, each subsequent year’s report has chosen this as its reference category.
- Reference:4The net change means the difference between the number of staff leaving and joining.
- Reference:5The GLA has a 15 grade salary scale for most staff in the organisation.
- Reference:6Prior to 2020, the GLA collected the ethnicity of its staff using a different classification. Instead of ‘Mixed’, there was an option for ‘Dual Heritage’. This is how the data was reported on prior to 2020, so should be borne in mind that they are not entirely comparable.
- Reference:7https://www.legislation.gov.uk/uksi/2017/172/regulation/4/made
- Reference:8Caution should be used when interpreting overall national and London pay gap figures. They are derived from the Annual Survey of Hours and Earnings (ASHE) and the ONS has acknowledged that interpreting average earnings data from this survey in the current climate is difficult. Pay gap calculations during the pandemic are difficult to disentangle, as they include people on furlough and job losses were not spread evenly across the working population or across different types of job. As an organisation, the GLA did not furlough any staff.
- Reference:9https://data.london.gov.uk/economic-fairness/labour-market/gender-pay-g…